Lesotho Climate Risk Mapping
Help & user guide
Purpose
This platform helps you explore climate-related risk information for Lesotho on an interactive map, together with charts and layer styling where data supports it. You can:
- View and analyze climate risk data through interactive maps
- Combine multiple data layers from various sources (WMS services and databases)
- Theme and style database layers based on attributes
- Create and customize charts for data visualization
- Explore spatial data with popups and tooltips
User Roles
Browser users can:
- View the Risk Explorer
- Select and view indicators
- Toggle layers and adjust opacity
- Theme database layers (temporarily)
- Create charts (temporarily)
- Interact with map features
Administrators can do everything Browser users can, plus:
- Create and manage sectors
- Create and manage risk indicators
- Add/remove layers from indicators
- Configure and save layer theming
- Configure and save chart settings
- Manage WMS and database connections
Signed-in access is not limited to a single “Browser” or “Administrator” label in practice: what a user can do depends on roles (permission claims), and which restricted catalogue rows they see can depend on groups.
Getting Started
Navigation overview
The header bar is the same on every page:
- Brand (Lesotho Climate Risk Mapping) — Returns to the home landing page: introduction, methodology, sector overview, and buttons such as Explore the Risk Map and User guide (this page).
- Risk explorer — Opens the map workspace: Climate Risk Catalogue on the left, map and charts in the centre, layer and chart controls on the right.
- Help — This page.
- Register / Sign in — Create an account or sign in. When signed in, your email (or name) and Sign out appear on the right.
Risk explorer
The Risk explorer is where you open indicators on the map and adjust layers and charts. The layout has three main areas:
Left — Climate Risk Catalogue
Sectors, indicators, and (where present) datasets in a tree you expand with + / −
Centre — Map & charts
Interactive map (with a compact context line when an indicator is selected) and charts below when configured
Right — Layers & chart config
Visibility, opacity, theming, and chart setup
Climate Risk Catalogue
The left panel is titled Climate Risk Catalogue. Sectors appear as dark rows: use + to expand and − to collapse. You can also click the sector name (when it has indicators) to expand or collapse. Under each sector, indicators are shown as sand-coloured pills. Indicators that have more than one dataset can be expanded the same way to see dataset names (smaller, grey text).
Choosing an indicator (the pill) loads that indicator on the map and updates the URL; indicators without expandable datasets stay aligned visually with those that have a + / − control.
Selecting indicators
- Open Risk explorer from the top navigation.
- In the Climate Risk Catalogue, expand a sector using + or by clicking the sector name.
- Click a risk indicator (the sand pill) to load it — the map opens that indicator and shows sector · indicator above the map.
- Associated WMS and database layers load according to configuration; use the Layers tab to show, hide, or restyle them.
- Charts appear under the map when they are configured and their layer is visible.
Base Maps
Base maps provide background context for your data layers.
Controlling Base Maps
- Open the Layers tab in the right panel
- Find the Base Maps section at the top
- Check/uncheck a base map to toggle visibility
- Use the Opacity slider to adjust transparency (0-100%)
Example: Base Maps Section
☑ OpenStreetMap        [━━━━━━━━━━] 100%
☐ Satellite Imagery    [━━━━━━━━━━] 80%
Layers Tab
The Layers tab is where you control layer visibility, opacity, and theming.
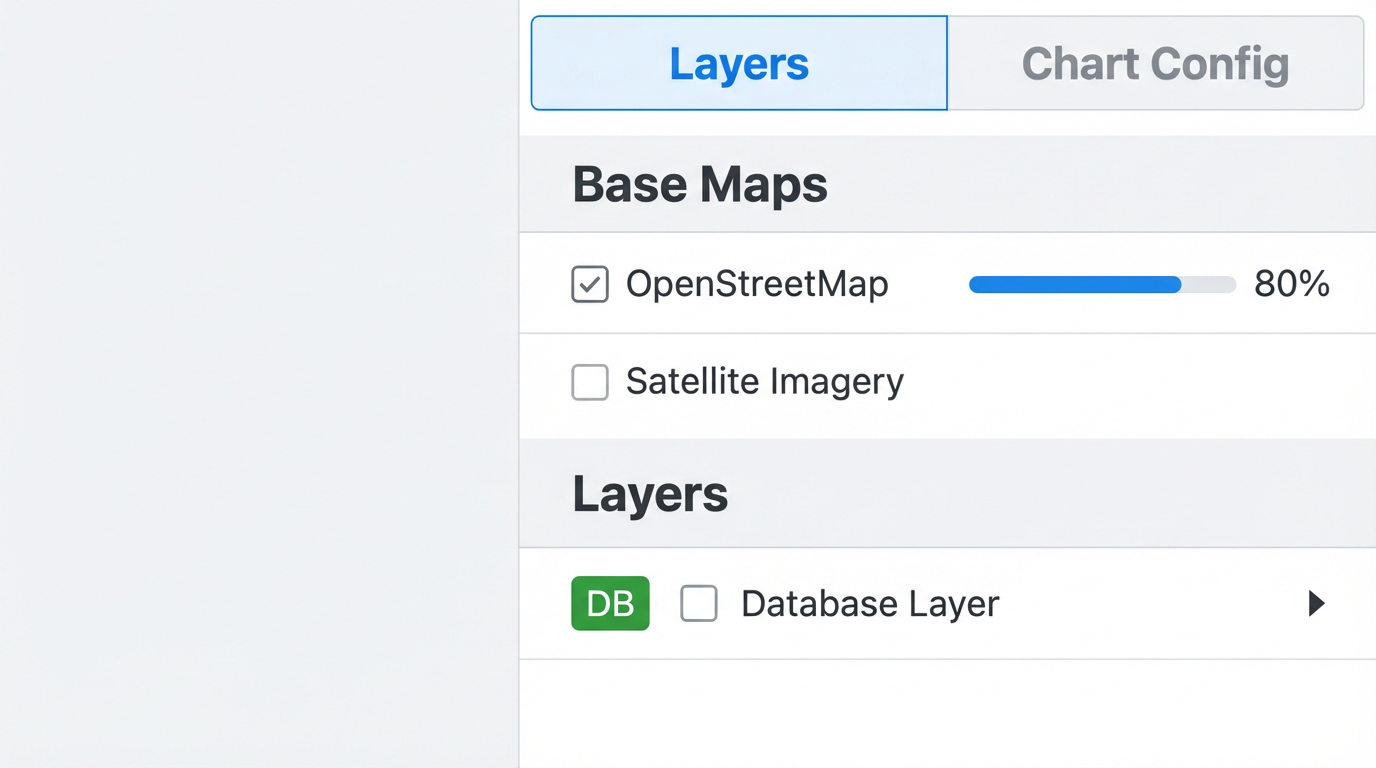
Figure: The Layers Tab showing base maps and layer controls
Layer Controls
For each layer in your selected indicator, you can:
- Toggle visibility - Check/uncheck the checkbox next to the layer name
- Adjust opacity - Use the slider (only appears when layer is visible)
- View legend - Automatically displayed for WMS layers when visible
- View theme legend - Displayed for themed database layers
Database Layers: Indicated with a green DB badge
Theming Database Layers
Database layers can be styled based on their attribute values, with custom labels and color schemes.
Theming allows you to visualize patterns in your data by coloring features based on attribute values.
How to Theme a Database Layer
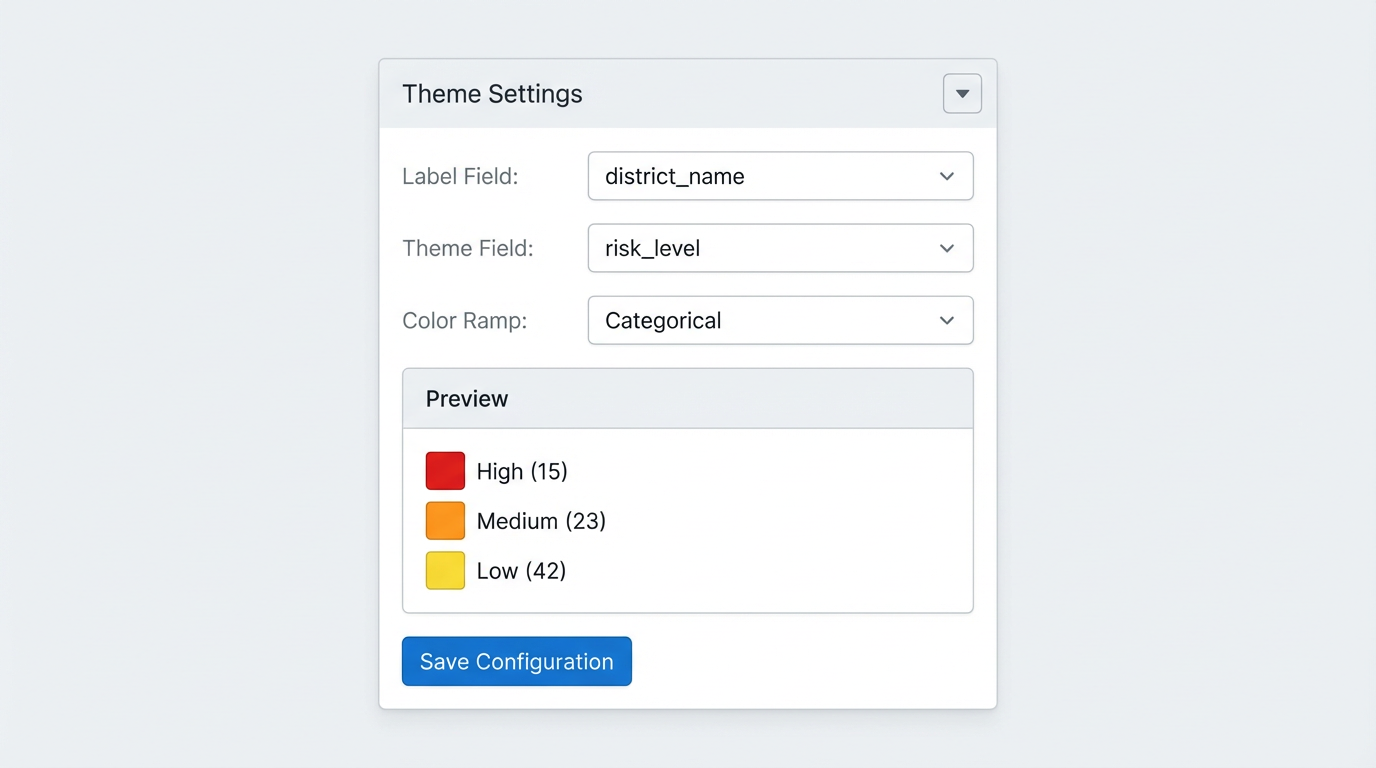
Figure: The Theme Settings panel for configuring database layer styling
- In the Layers tab, find a database layer (marked with DB)
- Click "▶ Theme Settings" to expand the configuration panel
- Label Field: Select a column to display as tooltips when hovering over features
- Theme Field: Select a column to color features by
- The system will fetch all unique values from this column
- Color Ramp: Choose a color scheme:
- Categorical - Distinct colors for categories
- Pastel - Soft, muted colors
- Earth Tones - Browns and greens
- Ocean Blues - Blue gradient
- Forest Greens - Green gradient
- Fire - Reds and oranges
- Rainbow - Full spectrum
- Monochrome - Grayscale
- Review the Preview showing color assignments
- Click "Apply"
Theme Legend
Once a layer is themed, a legend automatically appears showing:
- The column name being used for theming
- Color boxes for each unique value
- The value name and count of features
Viewing Charts
Charts provide a graphical representation of attribute data from database layers.
Where to Find Charts
Charts are displayed in the main content area, below the map. They automatically appear when:
- An indicator is selected
- The indicator has database layers with configured charts
- The database layer is visible
Chart Layout
- Charts are organized by database layer
- Each layer's charts are grouped under a heading: "[Layer Name] - Charts"
- Charts are displayed two per row for easy comparison
- Charts automatically update when you change theming or filters
Supported Chart Types
- Bar Chart - Compare values across categories
- Line Chart - Show trends over sequential data
- Scatter Plot - Plot numeric X vs Y values
- Pie Chart - Show proportions of a whole
- Doughnut Chart - Like pie, with center hollow
Configuring Charts
The right panel has two tabs:
- Layers Tab: Control visibility, opacity, and theming
- Chart Config Tab: Add, edit, and configure charts
Creating a New Chart
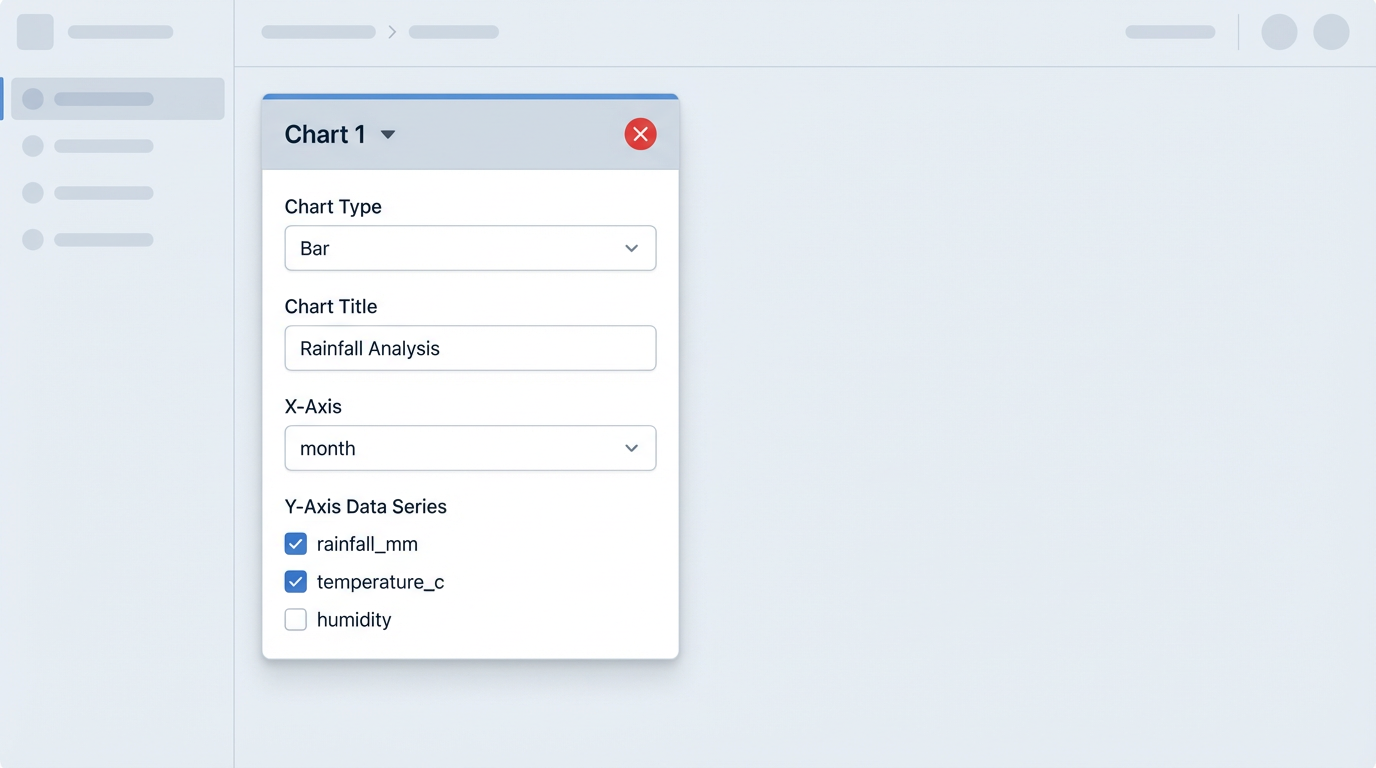
Figure: Chart configuration showing all available settings
- Switch to the Chart Config tab in the right panel
- Find the database layer you want to chart
- Click the ▶ button to expand that layer's configuration
- Click "+ Add" to create a new chart
- Click the ▶ button next to the new chart to expand its configuration
- Configure the chart:
- Chart Type: Select from dropdown (Bar, Line, Scatter, Pie, Doughnut)
- Chart Title: Optional descriptive title
- X-Axis: Select the column for X-axis values
- Y-Axis: Check one or more numeric columns to plot
- Multiple Y columns create multiple series on the same chart
- Click "Apply"
- The chart will appear below the map
Managing Charts
- Collapse/Expand Configuration: Click the ▶/▼ button next to each chart
- Edit Chart: Expand the chart and modify its settings, then click Apply/Save
- Remove Chart: Click the red ✕ button next to the chart
Map Interaction
Basic map controls
- Pan: Click and drag to move around the map
- Zoom: Use the mouse wheel or the +/− controls on the map
- Extent: The map zooms to show loaded layers when an indicator is opened
- The map sits inside a teal-outlined frame so it is easy to see on the page
Feature Interaction
For Database Layers:
- Hover: If a label field is configured, a tooltip displays the label value
- Click: A popup appears showing all attributes in a table format
- Attribute names appear in the left column (bold)
- Attribute values appear in the right column
- Each row is separated by a light border
- The popup is scrollable if there are many attributes
Example: Feature Popup
| district | Maseru |
| population | 431,998 |
| risk_level | High |
Tips & Best Practices
- Use the opacity slider to blend multiple layers and see through to base maps
- Turn off layers you don't need to reduce visual clutter
- Database layers with themes are more informative than plain layers
- Use Bar charts for comparing categories
- Use Line charts for time series or sequential data
- Use Scatter plots for exploring relationships between two numeric variables
- Use Pie/Doughnut charts for showing proportions (works best with 5-7 categories)
- Give charts descriptive titles to make them self-explanatory
- Select multiple Y-axis columns to compare related metrics
- Categorical data (text/names): Use Categorical, Pastel, or Rainbow
- Ordered data (low to high): Use Ocean Blues, Forest Greens, or Fire
- Neutral themes: Use Earth Tones or Monochrome
- Avoid Fire/Rainbow for large numbers of categories (colors repeat)
Troubleshooting
Layers Not Appearing
- Check that the layer checkbox is checked in the Layers tab
- Check that the layer opacity is greater than 0%
- For WMS layers, verify the WMS connection is working
- For database layers, verify the database connection is active
- Try zooming out - the layer might be outside your current view
Charts Not Displaying
- Verify the database layer is visible (checkbox checked)
- Check that the chart has an X-axis column selected
- Check that at least one Y-axis column is selected
- For numeric charts (scatter), ensure the columns contain numeric data
- Scroll down - charts appear below the map
Theming Not Working
- After selecting the Theme Field, wait for values to load
- Click "Apply" after making changes
- Verify the theme column exists in the database table
- Check that the layer is visible on the map
Map is Empty
- Select an indicator from the Climate Risk Catalogue on the left
- If no indicators appear, contact your administrator
Changes Not Saving (Browser Users)
As a browser user, your changes are temporary and will be reset when you refresh the page. This is by design. If you need permanent configurations, contact your administrator.
Performance Issues
- Turn off layers you're not actively using
- Avoid having many database layers visible simultaneously
- Large datasets may take time to load - be patient
- Close the browser tab and start fresh if the application becomes sluggish
Still Having Problems?
If you continue to experience issues:
- Try refreshing the page (Ctrl+F5 for hard refresh)
- Clear your browser cache
- Try a different browser
- Contact your system administrator
Lesotho Climate Risk Mapping — User guide v1.2
Last Updated: June 2026